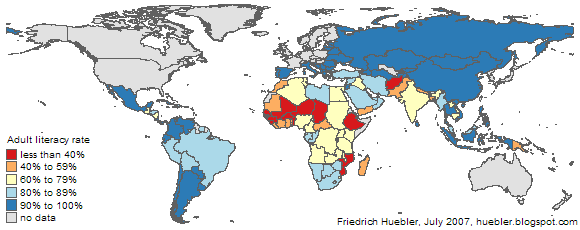
Millennium Development Goal 3 calls for gender equality and the empowerment of women. One aspect of gender equality is literacy among men and women. In June 2007, the
UNESCO Institute for Statistics (UIS) released new statistics on
adult literacy and
youth literacy. The adult literacy rate represents the population aged 15 years and older and the youth literacy rate the population aged 15 to 24 years. The most recent literacy data is from the year 2005.
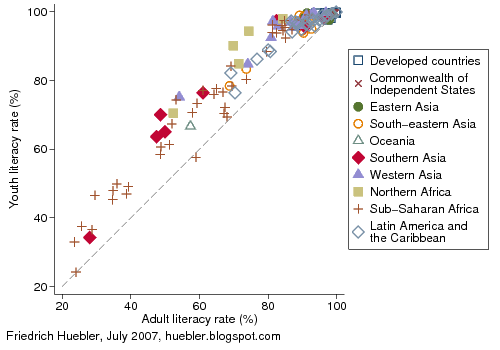
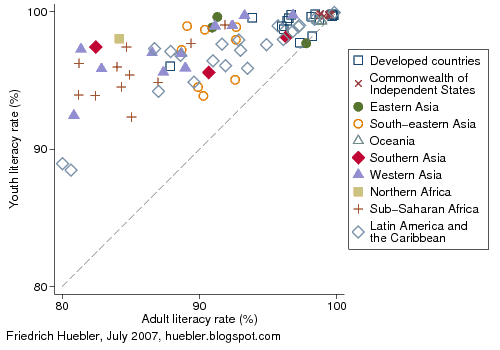
Figure 1 compares the male and female literacy rates in 135 countries. The male literacy rate is plotted along the horizontal axis and the female literacy rate along the vertical axis. For each country, up to two points are drawn, one for adult literacy and one for youth literacy. The location of a country relative to the 45 degree line indicates whether more men or women are literate. If the literacy rate of men and women is the same, the country's marker is located on the 45 degree line. If the male literacy rate is higher than the female literacy rate, the marker is below the 45 degree line. In countries above the 45 degree line, a higher share of women is literate.
Figure 1: Male and female literacy rates
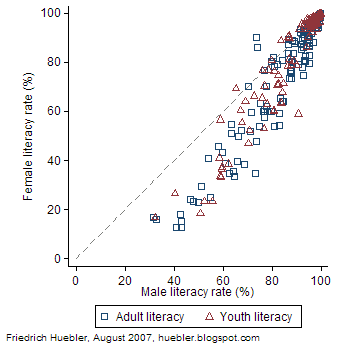
Source: UNESCO Institute for Statistics, Data Centre, June 2007.
The distribution of the points in Figure 1 shows clearly that in most countries the female literacy rate is below the male literacy rate. In Afghanistan, only 12.6 percent of all women over 15 years can read and write, compared to 43.1 percent of men. In Chad, the female literacy rate is 12.8 percent and the male literacy rate 40.8 percent. In four more countries, fewer than 20 percent of all women are literate: Niger (15.1 percent), Mali (15.9 percent), Burkina Faso (16.6 percent), and Guinea (18.1 percent). In 23 countries in total, less than half of the adult female population can read and write.
Male literacy rates are generally at a higher level but 8 countries have male adult literacy rates below 50 percent. In addition to Afghanistan and Chad, these countries are: Burkina Faso (male literacy rate 31.4 percent), Mali (32.7 percent), Guinea (42.6 percent), Niger (42.9 percent), Sierra Leone (46.7 percent), and Benin (47.9 percent).
Table 1 summarizes the literacy data from UNESCO. On average, the difference between male and female literacy rates is 12.8 percent among the adult population and 7.2 percent among the population aged 15 to 24 years. The smaller gender disparity among youth is due to trends in school attendance over the past years. Attendance has increased for both boys and girls but attendance rates have grown at a faster pace among girls.
Table 1: Male and female literacy rates
| Adult or youth literacy | Countries
with data | Male literacy
rate (%) | Female literacy
rate (%) | Difference male-female
literacy rate (%) |
| Adult literacy (15 years and older) | 135 | 84.9 | 72.1 | 12.8 |
| Youth literacy (15-24 years) | 132 | 89.4 | 82.2 | 7.2 |
Source: UNESCO Institute for Statistics, Data Centre, June 2007. Average values are weighted by each country's adult and youth population.
In spite of the movement towards gender equality, large gaps remain. In four countries, the gap between male and female literacy among the adult population is greater than 30 percent: Yemen (male literacy rate 73.1 percent, female 34.7 percent, difference 38.4 percent), Central African Republic (male 64.8, female 33.5, difference 32.3), Afghanistan (male 43.1, female 12.6, difference 30.5), and Togo (male 68.7, female 38.5, difference 30.2). In 18 more countries, the male-female gap is between 20 and 30 percent. These countries are, in descending order of the size of the gap: Mozambique (difference male-female literacy rate 29.9 percent), Pakistan, Angola, Chad, Niger, Nepal, Ethiopia, Democratic Republic of the Congo, Morocco, India, Benin, Guinea, Egypt, Sierra Leone, Cote d'Ivoire, Senegal, Malawi, and Cambodia (difference 20.6 percent).
In a few countries, female literacy rates are above male literacy rates. In Lesotho, 90.3 percent of all women aged 15 years and older are literate, compared to 73.7 percent of all men (difference 16.6 percent). In Jamaica, the adult literacy rate is 85.9 percent among women and 74.1 percent among men (difference 11.8 percent). In four more countries, the literacy rate of women is between 3 and 1 percent above the male literacy rate: Malta, Philippines, Botswana, and Uruguay.
The youth literacy rate among the female population is more than 1 percentage point above the male literacy rate in 16 countries (listed in descending order of the gap): Nicaragua, Liberia, Honduras, El Salvador, Botswana, Malta, Philippines, Swaziland, Qatar, Dominican Republic, Namibia, Brazil, Venezuela, Mauritius, Mongolia, and Sri Lanka. The difference between female and male youth literacy rates in this group of countries ranges from 5.2 percent in Nicaragua to 1.1 percent in Sri Lanka.
In 15 countries, the male youth literacy rate is 20 or more percent above the female youth literacy rate. These countries are, in descending order of the literacy gap: Chad (difference male-female literacy rate 32.5 percent), Afghanistan, Yemen, Niger, Benin, Guinea, Ethiopia, Pakistan, Central African Republic, Mozambique, Sierra Leone, Angola, Nepal, Morocco, and Togo (difference 20.1 percent).
To download the latest national literacy rates, please visit the
UIS Data Centre.
Related articles
External links
Friedrich Huebler, 5 August 2007 (edited 17 October 2008), Creative Commons License
Permanent URL: http://huebler.blogspot.com/2007/08/disparity-between-male-and-female.html
 On 10 December 2007, UNICEF launched a new publication, Progress for Children: A World Fit for Children Statistical Review. With more than 60 pages of graphs and tables, the report draws a detailed statistical picture of the current state of the world's children. The publication is divided into sections organized by Millennium Development Goal.

 On 29 November 2007, UNESCO released the 2008 edition of the annual


 The UNESCO Institute for Statistics has released the
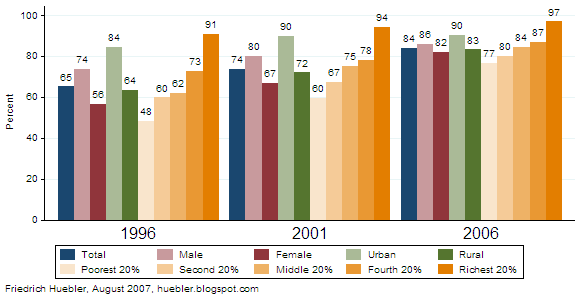

 In June 2007, the United Nations published the latest edition of its annual report on progress toward the