One component of the EDI is the adult literacy rate. The adult literacy rate usually indicates the share of literate persons in the population aged 15 years and older. In countries, where the literacy rate is not available, a proxy measure is substituted for the calculation of the EDI. This proxy measure is the share of the adult population with at least a complete primary education (UNESCO 2006, p. 201, note 2).
To evaluate whether this proxy is indeed a good substitute for the adult literacy rate, it is necessary to know if all children with a complete primary education can in fact be considered literate. Various household surveys collect data on literacy, among them the Multiple Indicator Cluster Surveys (MICS) funded by UNICEF, and the Demographic and Health Surveys (DHS) funded by the United States Agency for International Development (USAID).
Previous MICS surveys collected data on literacy by asking household members aged 15 years and older if they can read a letter or newspaper easily, with difficulty, or not at all (UNICEF 2000, model questionnaire, p. Q.3). Previous DHS surveys asked if a person can read and write in any language without any difficulty (e.g., NSEO Eritrea and ORC Macro 2003, Appendix E, p. 263). More recent surveys, including the latest MICS surveys conducted in 2005 and 2006, use a more direct approach than self-assessment. Household members are shown a card with a simple sentence and are asked to read it. Example sentences are "The child is reading a book," "The rains came late this year," or "Farming is hard work" (UNICEF 2006, Appendix 2, p. A2.14).
This article examines data from 4 DHS and 22 MICS surveys in Sub-Saharan Africa that collected data on literacy with one of the methods described above. The 26 surveys were conducted between 1999 and 2004. In addition to literacy, the surveys also identified the highest level of education of each household member at least 5 or 6 years old. For the analysis, household members were divided into 13 groups according to the highest grade of formal education completed: no formal education, grade 1 completed, grade 2 completed, ..., grade 11 completed, and grade 12 or higher completed. Within each group, the share of literate persons was calculated. The results are plotted in the graphs below.
To reduce the number of countries in a graph, the countries were grouped according to the geographic regions used by UNICEF. The first graph shows 11 countries in Eastern and Southern Africa. For each country, a line indicates how the percentage of literate persons varies with the completed years of formal education. For example, in Kenya (the red line in the graph), 11 percent of all persons without formal education are literate, compared to 36 percent of those who completed the first grade, 49 percent of those who completed the second grade, and so on. The number in parentheses behind the name of each country indicates the official length of primary education in years. For example, primary school has four grades in Angola and six grades in Burundi.
The theory underlying the EFA Development Index assumes that all persons with a complete primary education are literate. The graph for Eastern and Southern Africa shows that this is mostly true. In Angola, Comoros, Somalia, and Swaziland, the literacy rate of persons who did not continue their education after completing primary school ranges from 95 to 97 percent and with additional years of education the literacy rate increases further. In Eritrea, Ethiopia, Kenya, Lesotho, Mozambique, and Rwanda, the literacy rate of persons with primary education only is 99 to 100 percent. Burundi is an exception; here, the literacy rate of persons with 6 years of education (the official length of primary school) is only 90 percent. Closer inspection of the data shows that this is due to relatively high illiteracy among the older population, who attended school more than 20 years ago. For persons with 7 or more years of education, the literacy rate approaches 100 percent in Burundi.
Years of education and literacy in Eastern and Southern Africa
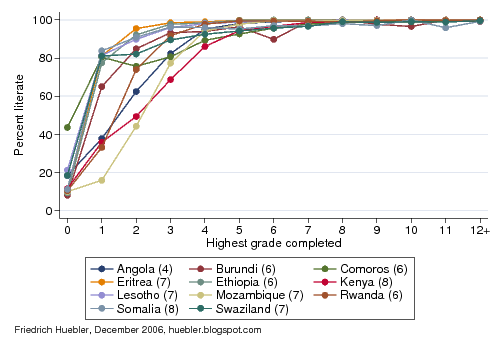
Data source: 3 DHS and 8 MICS surveys, 1999-2004. - Number after country name indicates official duration of primary education.
The second graph displays the link between years of schooling and literacy in 15 countries from West and Central Africa. A comparison of the two graphs reveals a striking difference between the two regions. In Eastern and Southern Africa, a literacy rate of more than 80 percent is reached after 4 years of education; after 5 years, at least 90 percent of the population are literate. In West and Central Africa, only 6 of 15 countries have at least 80 percent literacy after 4 years of education. A 90 percent literacy rate is only reached after 7 to 8 years of school, and in Gambia, 9 years are needed to reach the same goal.
Years of education and literacy in West and Central Africa
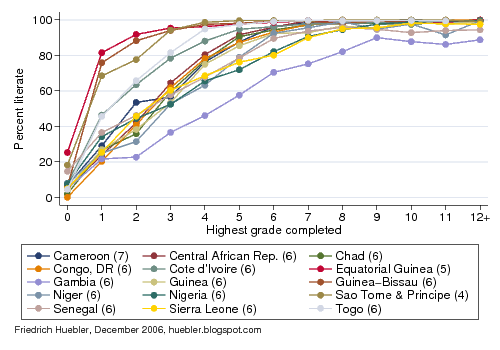
Data source: 1 DHS and 14 MICS surveys, 2000-2003. - Number after country name indicates official duration of primary education.
Overall, the literacy rates of persons with no more than primary education are much lower than in Eastern and Southern Africa. The lowest literacy rates among primary school graduates are observed in Gambia (71 percent), Sierra Leone (80 percent), and Nigeria (82 percent). In Chad, the Democratic Republic of Congo, Guinea, Niger, and Senegal, the literacy rate of persons with primary education only ranges from 90 to 94 percent. In the Central African Republic and Côte d'Ivoire, the literacy rate of primary school graduates is 96 percent; in Equatorial Guinea it is 98 percent; and in Cameroon, Guinea-Bissau, Sao Tome and Principe, and Togo, 99 percent of primary school graduates are literate.
The analysis of years of schooling and corresponding literacy rates underlines the relatively poor state of the education system in many parts of West and Central Africa. Compared to other regions, countries in West and Central Africa not only have the lowest school attendance or enrollment rates on average, children also take longer to learn basic skills like reading and writing.
Returning to the question asked at the beginning of this article, is the share of the adult population with at least a complete primary education a suitable proxy for the adult literacy rate? The evidence from Sub-Saharan Africa shows that this indicator is not perfect, especially in countries where schools struggle to provide a high-quality education for all students. Yet, in spite of these limitations, most persons who graduated from primary school or attended higher levels of education can be considered literate. The share of the population with at least a complete primary education is therefore a good substitute for the adult literacy rate.
Correction, 7 December 2006: An earlier version of this article included data for Madagascar. All references to Madagascar were removed because the Madagascar 2000 MICS, on which the analysis was based, only provides data on education for persons up to 17 years of age. The literacy data is therefore not representative for the entire population of Madagascar.
References
- National Statistics and Evaluation Office (NSEO) [Eritrea] and ORC Macro. 2003. Eritrea Demographic and Health Survey 2002. Calverton, Maryland: National Statistics and Evaluation Office and ORC
Macro. - UNESCO. 2006. Education for All Global Monitoring Report 2007: Strong foundations - Early childhood care and education. Paris: UNESCO.
- UNICEF. 2000. End-decade Multiple Indicator Cluster Survey manual: Monitoring progress toward the goals of the 1990 World Summit for Children. New York: UNICEF.
- UNICEF. 2006. Multiple Indicator Cluster Survey manual 2005: Monitoring the situation of children and women. New York: UNICEF.
- Years of schooling and literacy, part 2
- EFA Development Index: Assessing progress toward Education for All
- Education data from household surveys
- Primary school enrollment in 2004
- Millennium Development Goal regions and UNICEF regions
- Multiple Indicator Cluster Surveys
- Demographic and Health Surveys
- Education for All Global Monitoring Report 2007
Permanent URL: http://huebler.blogspot.com/2006/11/years-of-schooling-and-literacy-can.html


2 comments:
Dear Friedrich,
It was nice to discover your websites as I also work on the international education data and I do have lots of small comments at various levels. I read your analysis and I would like to add something. The proxy that EDI is taking for adult literacy rate is the share of the adult population with at least a complete primary education, however, in your graphs you have shown that even those without formal education are literate and more literates in other groups. Hence, EDI is underestimating a lot of literates. I hope I made my point clear.
Samir
(kc_samirktm@yahoo.com)
Thank you for your comments, Samir. You are right, many people learn to read and write without formal education. It is important to offer literacy programs to those who had no opportunity to attend school when they were children. Being able to read and write is a crucial skill that is directly linked to the Millennium Development Goals.
Post a Comment